The Collection Trust booklet provides very specific guidance on marking items. It advises that items are labelled and marked in ways which are:
- Secure – The chances of accidental removal of the label or mark from the object
- must be extremely low.
- Reversible – It should be possible for a label or mark to be removed intentionally
- from an object, even after 50-100 years with as little trace as possible.
- Safe for the object – Neither the materials applied to the object nor the method by
- which they are applied should risk significant damage to the object.
- Discreet but visible – The recommended methods should not spoil the appearance
- of the object, nor obscure important detail. However, the number should be visible
- enough to reduce the need to handle the object.
For the positioning of labels and marks it suggests that you should:
- Avoid physically unstable surfaces. Also avoid placing labels or marks across a line
- of weakness or fracture.
- Choose a position so that the number is unlikely to be visible when the object is on
- display but is accessible in store.
- Avoid decoration and painted/varnished/pigmented/waxed areas.
- Avoid surfaces where the mark is likely to be at risk from abrasion, such as surfaces
- on which it normally rests, or where touched during handling.
- Locate the number so that the handling necessary to read it is minimised (consider
- marking the packaging or adding an extra tie-on label as well).
- With composite objects, mark the part on which the most secure method can be
- Where duplicate marks are made these should be in different positions on the object
- (bearing in mind, of course, the other principles listed above).
And for writing on objects, it recommends the following:
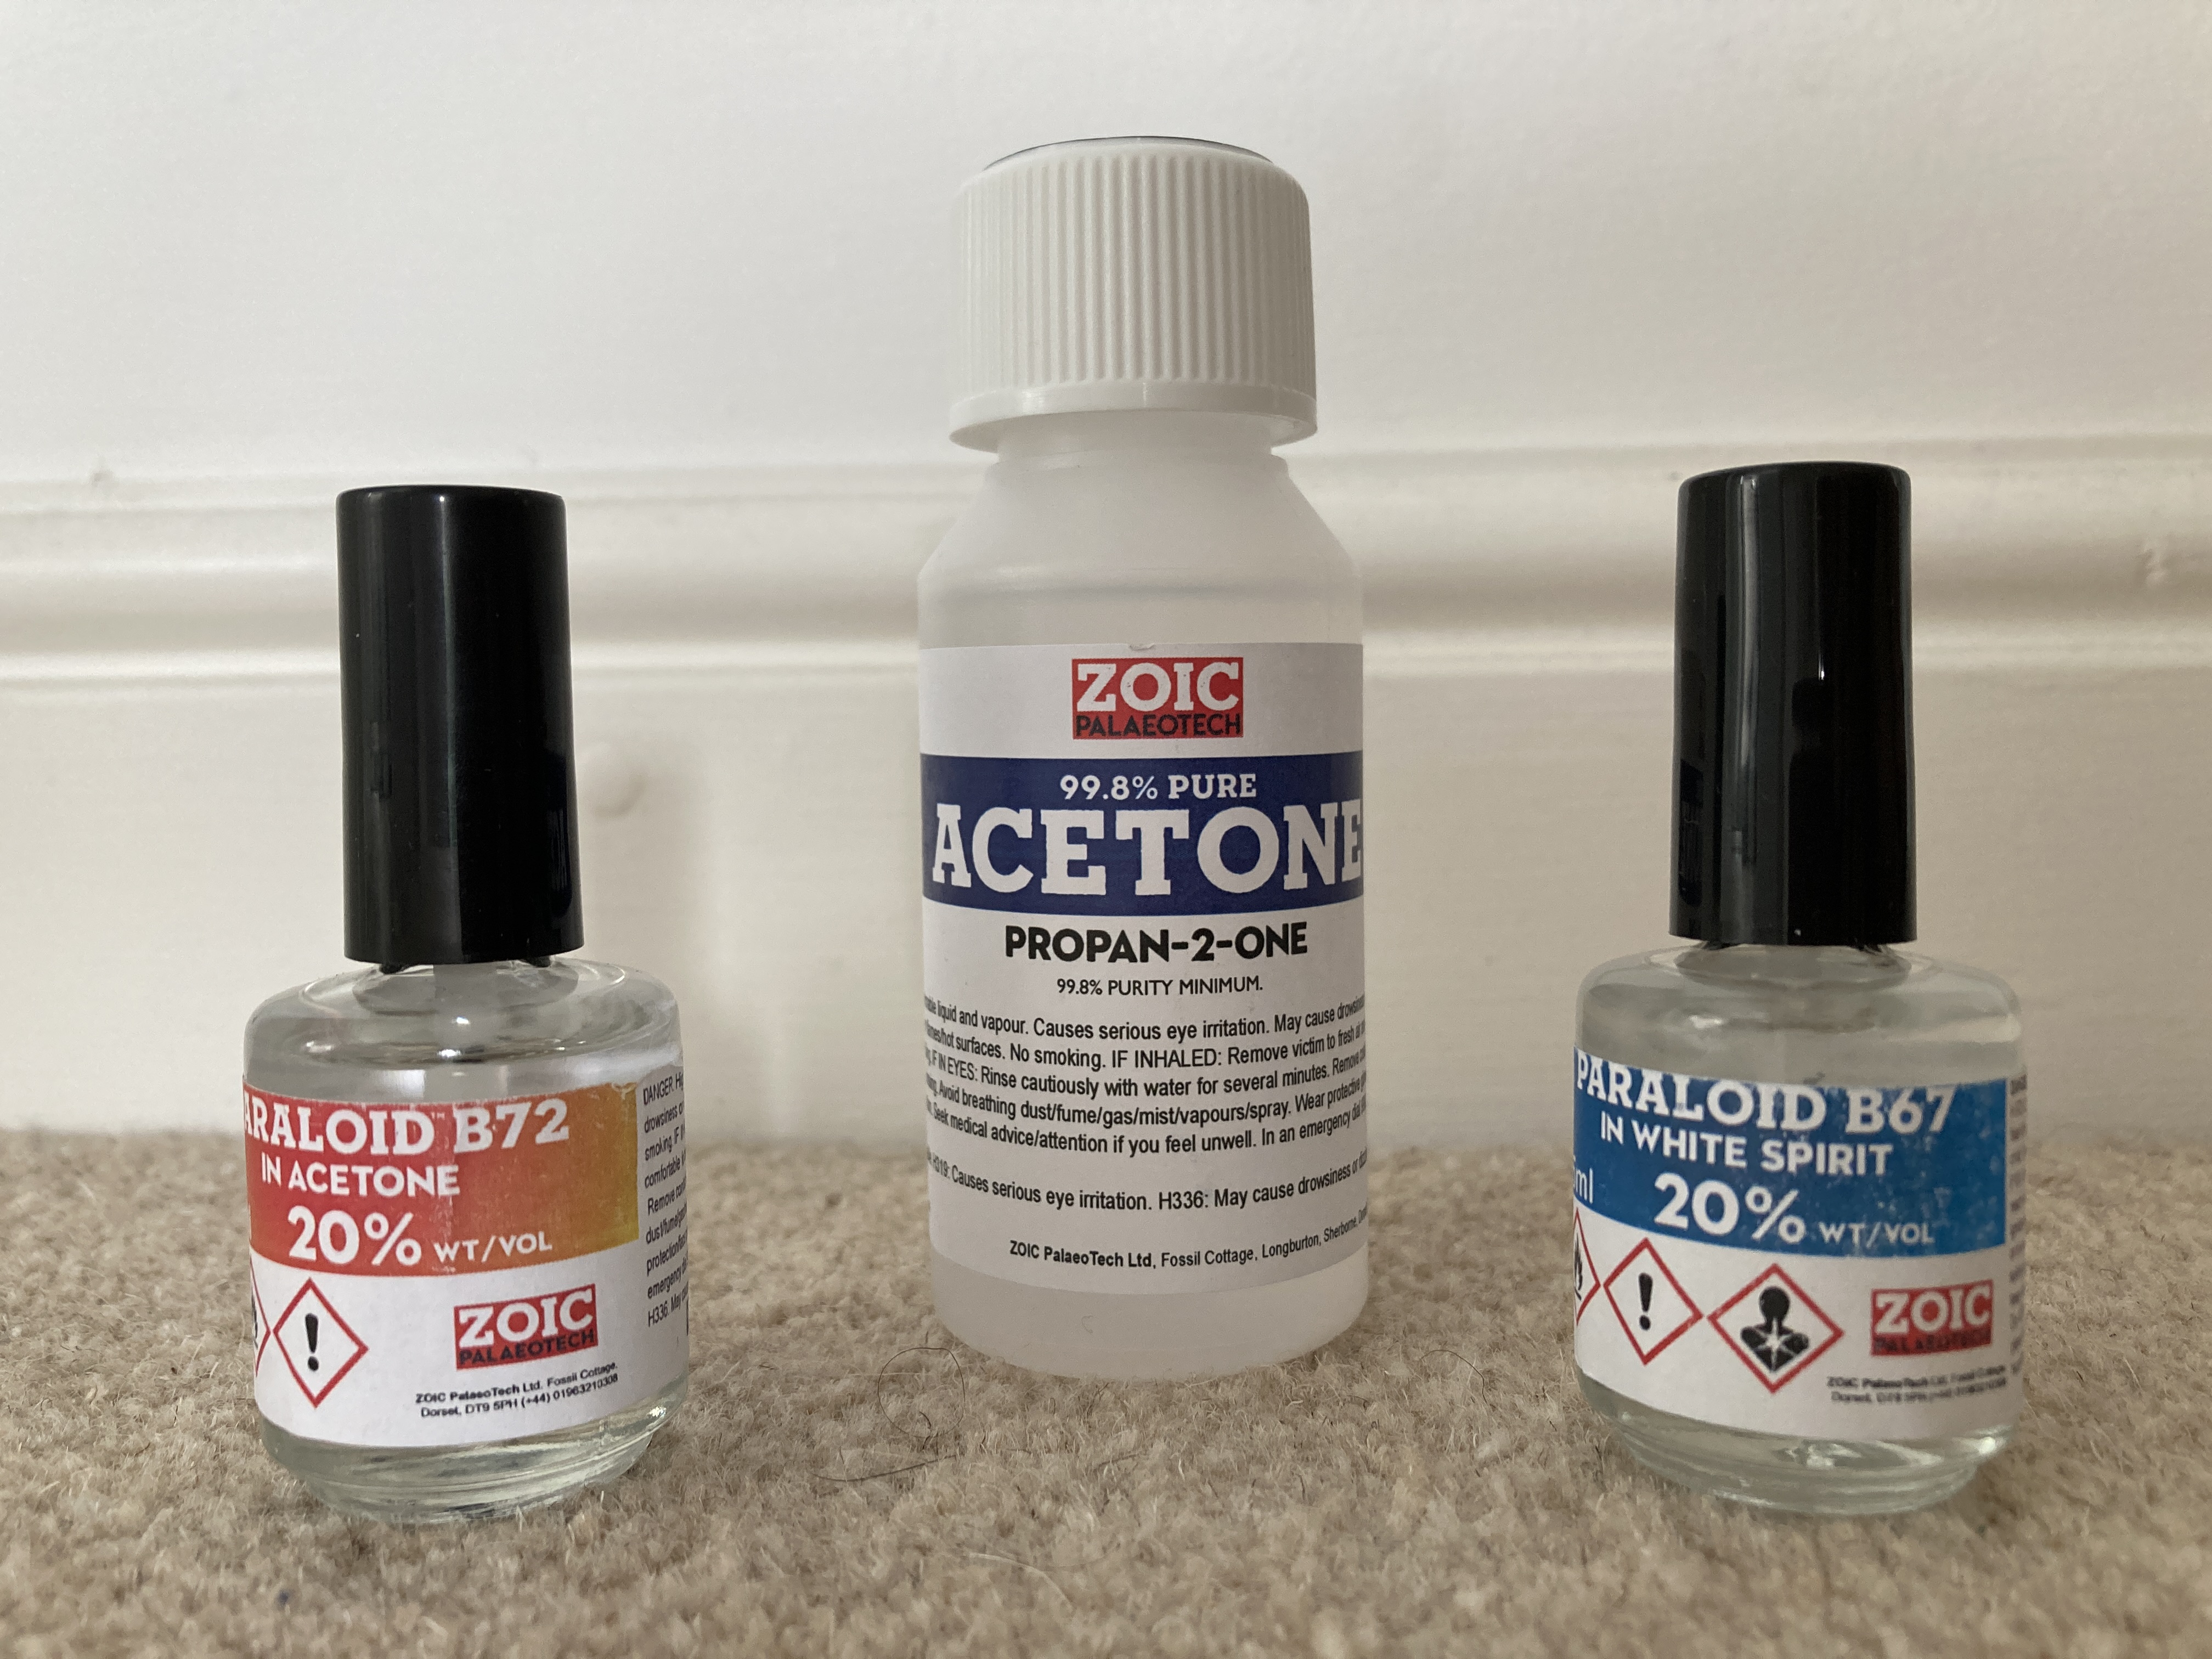
- Apply B72 20%-in-acetone as a base barrier coat on the object.
- Write the Ref. No. with a permanent black or white marker.
- Apply B67 20%-in-white spirit as a top coat.
Should a mistake be made, this combination can be easily removed with acetone.
I duly searched the internet and found several suppliers of these items. In the end I bought small bottles of 20% B72 and 20% B67, a bottle of acetone, and a fine marker pen for about £20 from ZOIC PalaeoTech Limited.
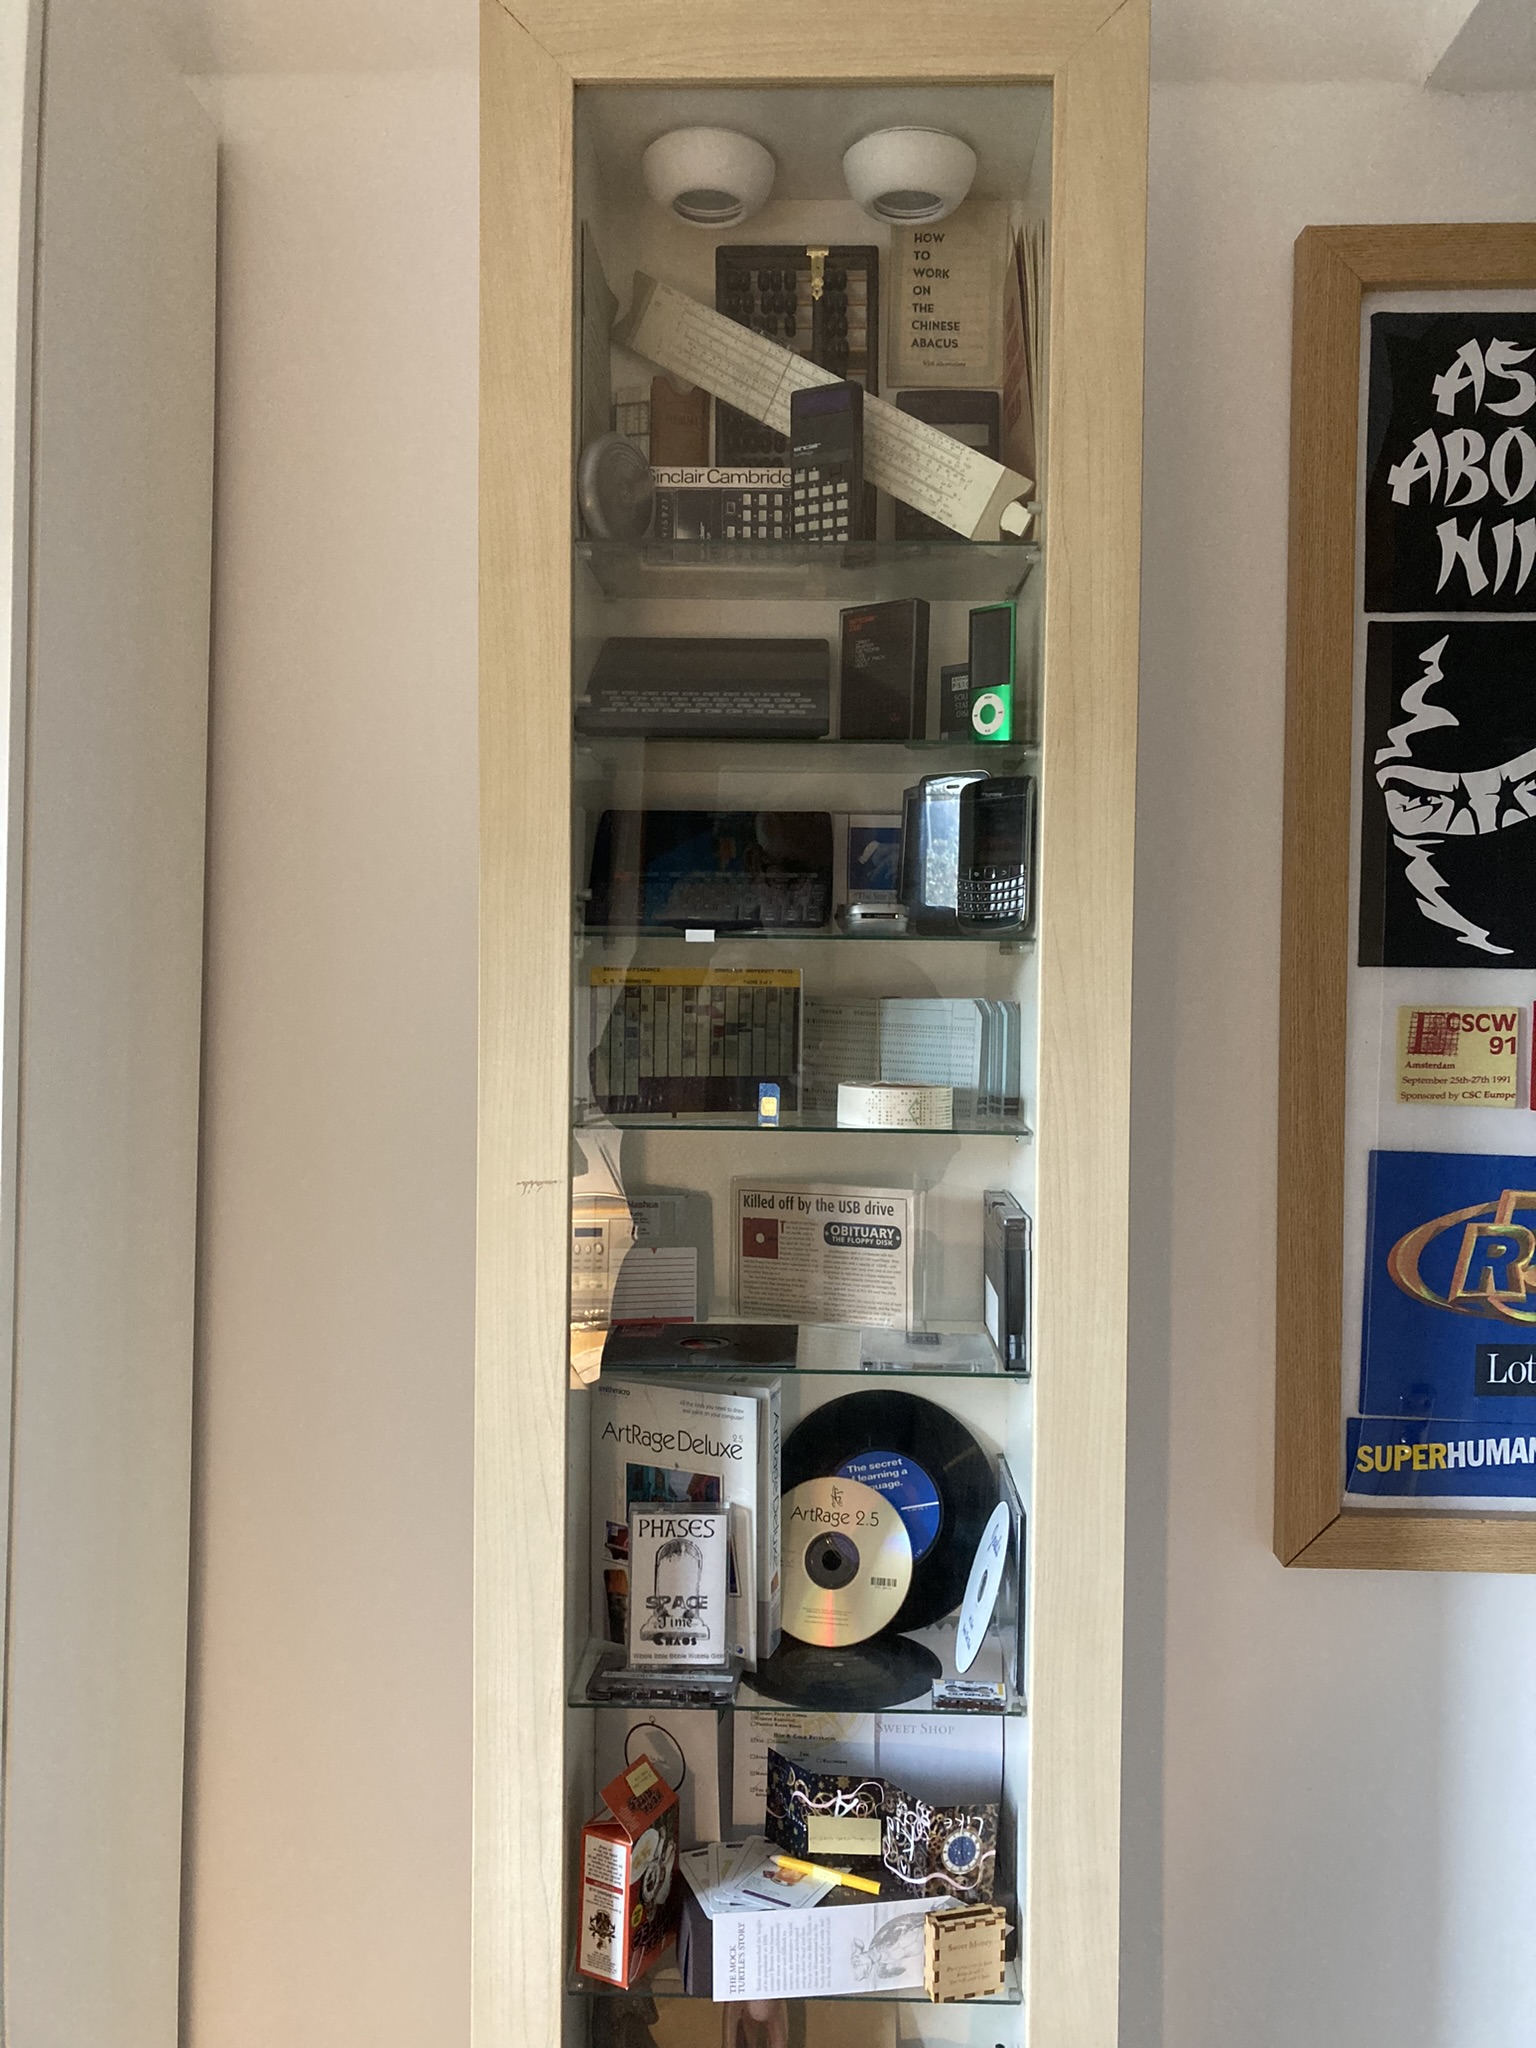
 After a couple of tests applying base coat, pen, and top coat, I set about removing the items from the cabinet, matching them up with any packaging etc. that had been stored separately, and creating relevant index entries.
Guidance on drying times for base coat, pen, and top coat, ranges from a few minutes to 24 hours. I chose to try to space out each part of the process by at least a few hours, and then it soon became apparent that I needed some systematic way of knowing which items were at which stage of the process. My answer was to have separate adjacent areas on my desk for each stage, so that the objects would progress from right to left.
Use of the B72 and B67 solutions wasn’t difficult; the brush applicators built into the bottle tops make it easy to apply a line in a single stroke. However, my nose certainly did pick up the strong odours emanating from the bottles; advice on open windows and, possibly, wearing a mask is worth taking note of.
Decisions on whether to use either a black marker or a white marker were easily made based on which one would stand out best on the relevant background. However, marker pens were certainly not the only way I labelled items. My preferred option was to used stringed labels whenever I found a way of attaching them: of the 223 separate objects dealt with in this exercise, stringed labels were applied to 134 of them, while Ref. Nos. were painted onto only 51. The table below summarises all the different labelling techniques I used across the collection.
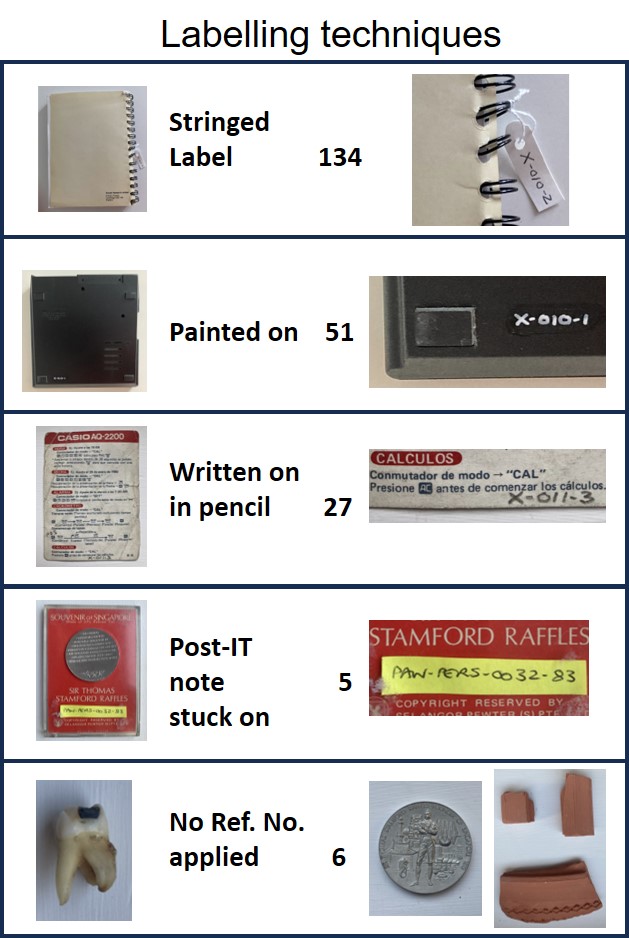 Did I follow the advice in the Collection Trust booklet? Well, broadly speaking, yes when painting-on the Ref. Nos. or using stringed labels. However, for the 12% of items on which I pencilled-on the Ref. Nos. I suspect I wasn’t following best practice; and, as for the use of Post-IT notes, well I know myself that they come away very easily. In my defence, all of the Post-IT items had been previously labelled in that way and I saw no better way of labelling them. The final category in the table above – ‘No Ref. No. applied’, is of course completely contradictory to the guidance. However, there were good reasons for not labelling each of them: one is a SIM card that is just too small to write on and, in any case, is unlikely to be lost as it is located inside an iPhone; another is the commemorative coin shown in the table above, for which a painted-on Ref. No. would certainly detract from its quality. A similar rationale applies to the tooth shown in the table – it is too small and irregular to have a Ref. No. painted-on, and even the string of a label wrapped around it would obstruct its inspection. The final items are three pieces of terracotta pottery which, according to the marketing letter accompanying them, are supposed to have just been found in the desert sands – a claim which would not stand up if a Ref No. appeared on them in any shape or form.
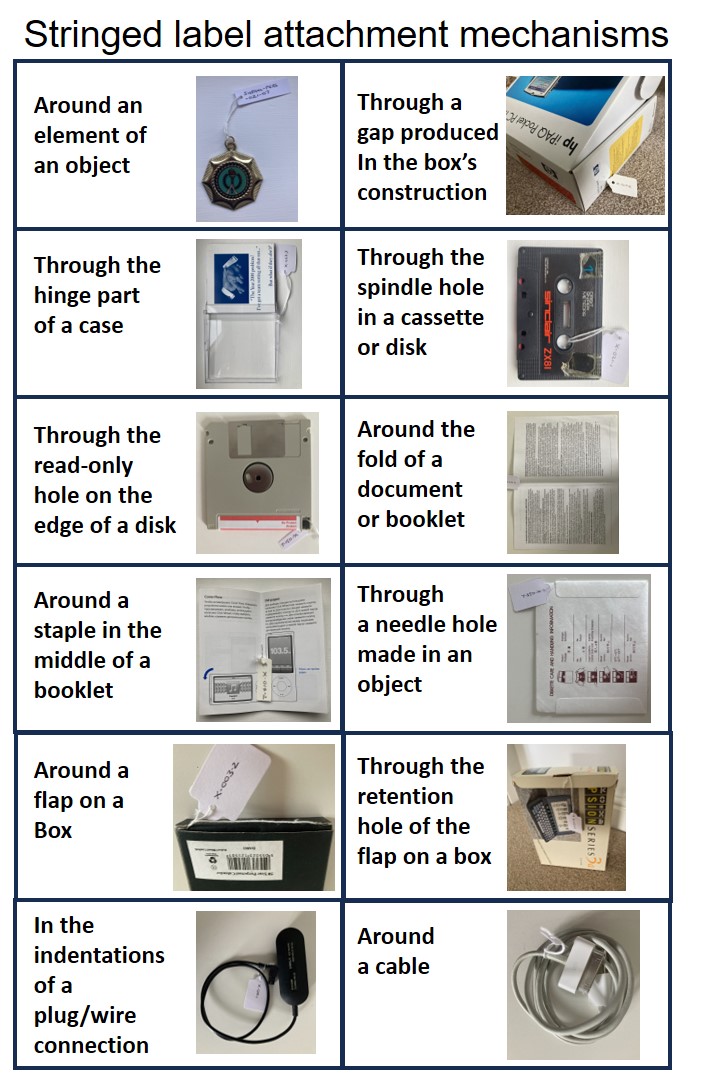
Regarding my use of stringed labels, I found a variety of different ways of attaching them, as illustrated in the table below.
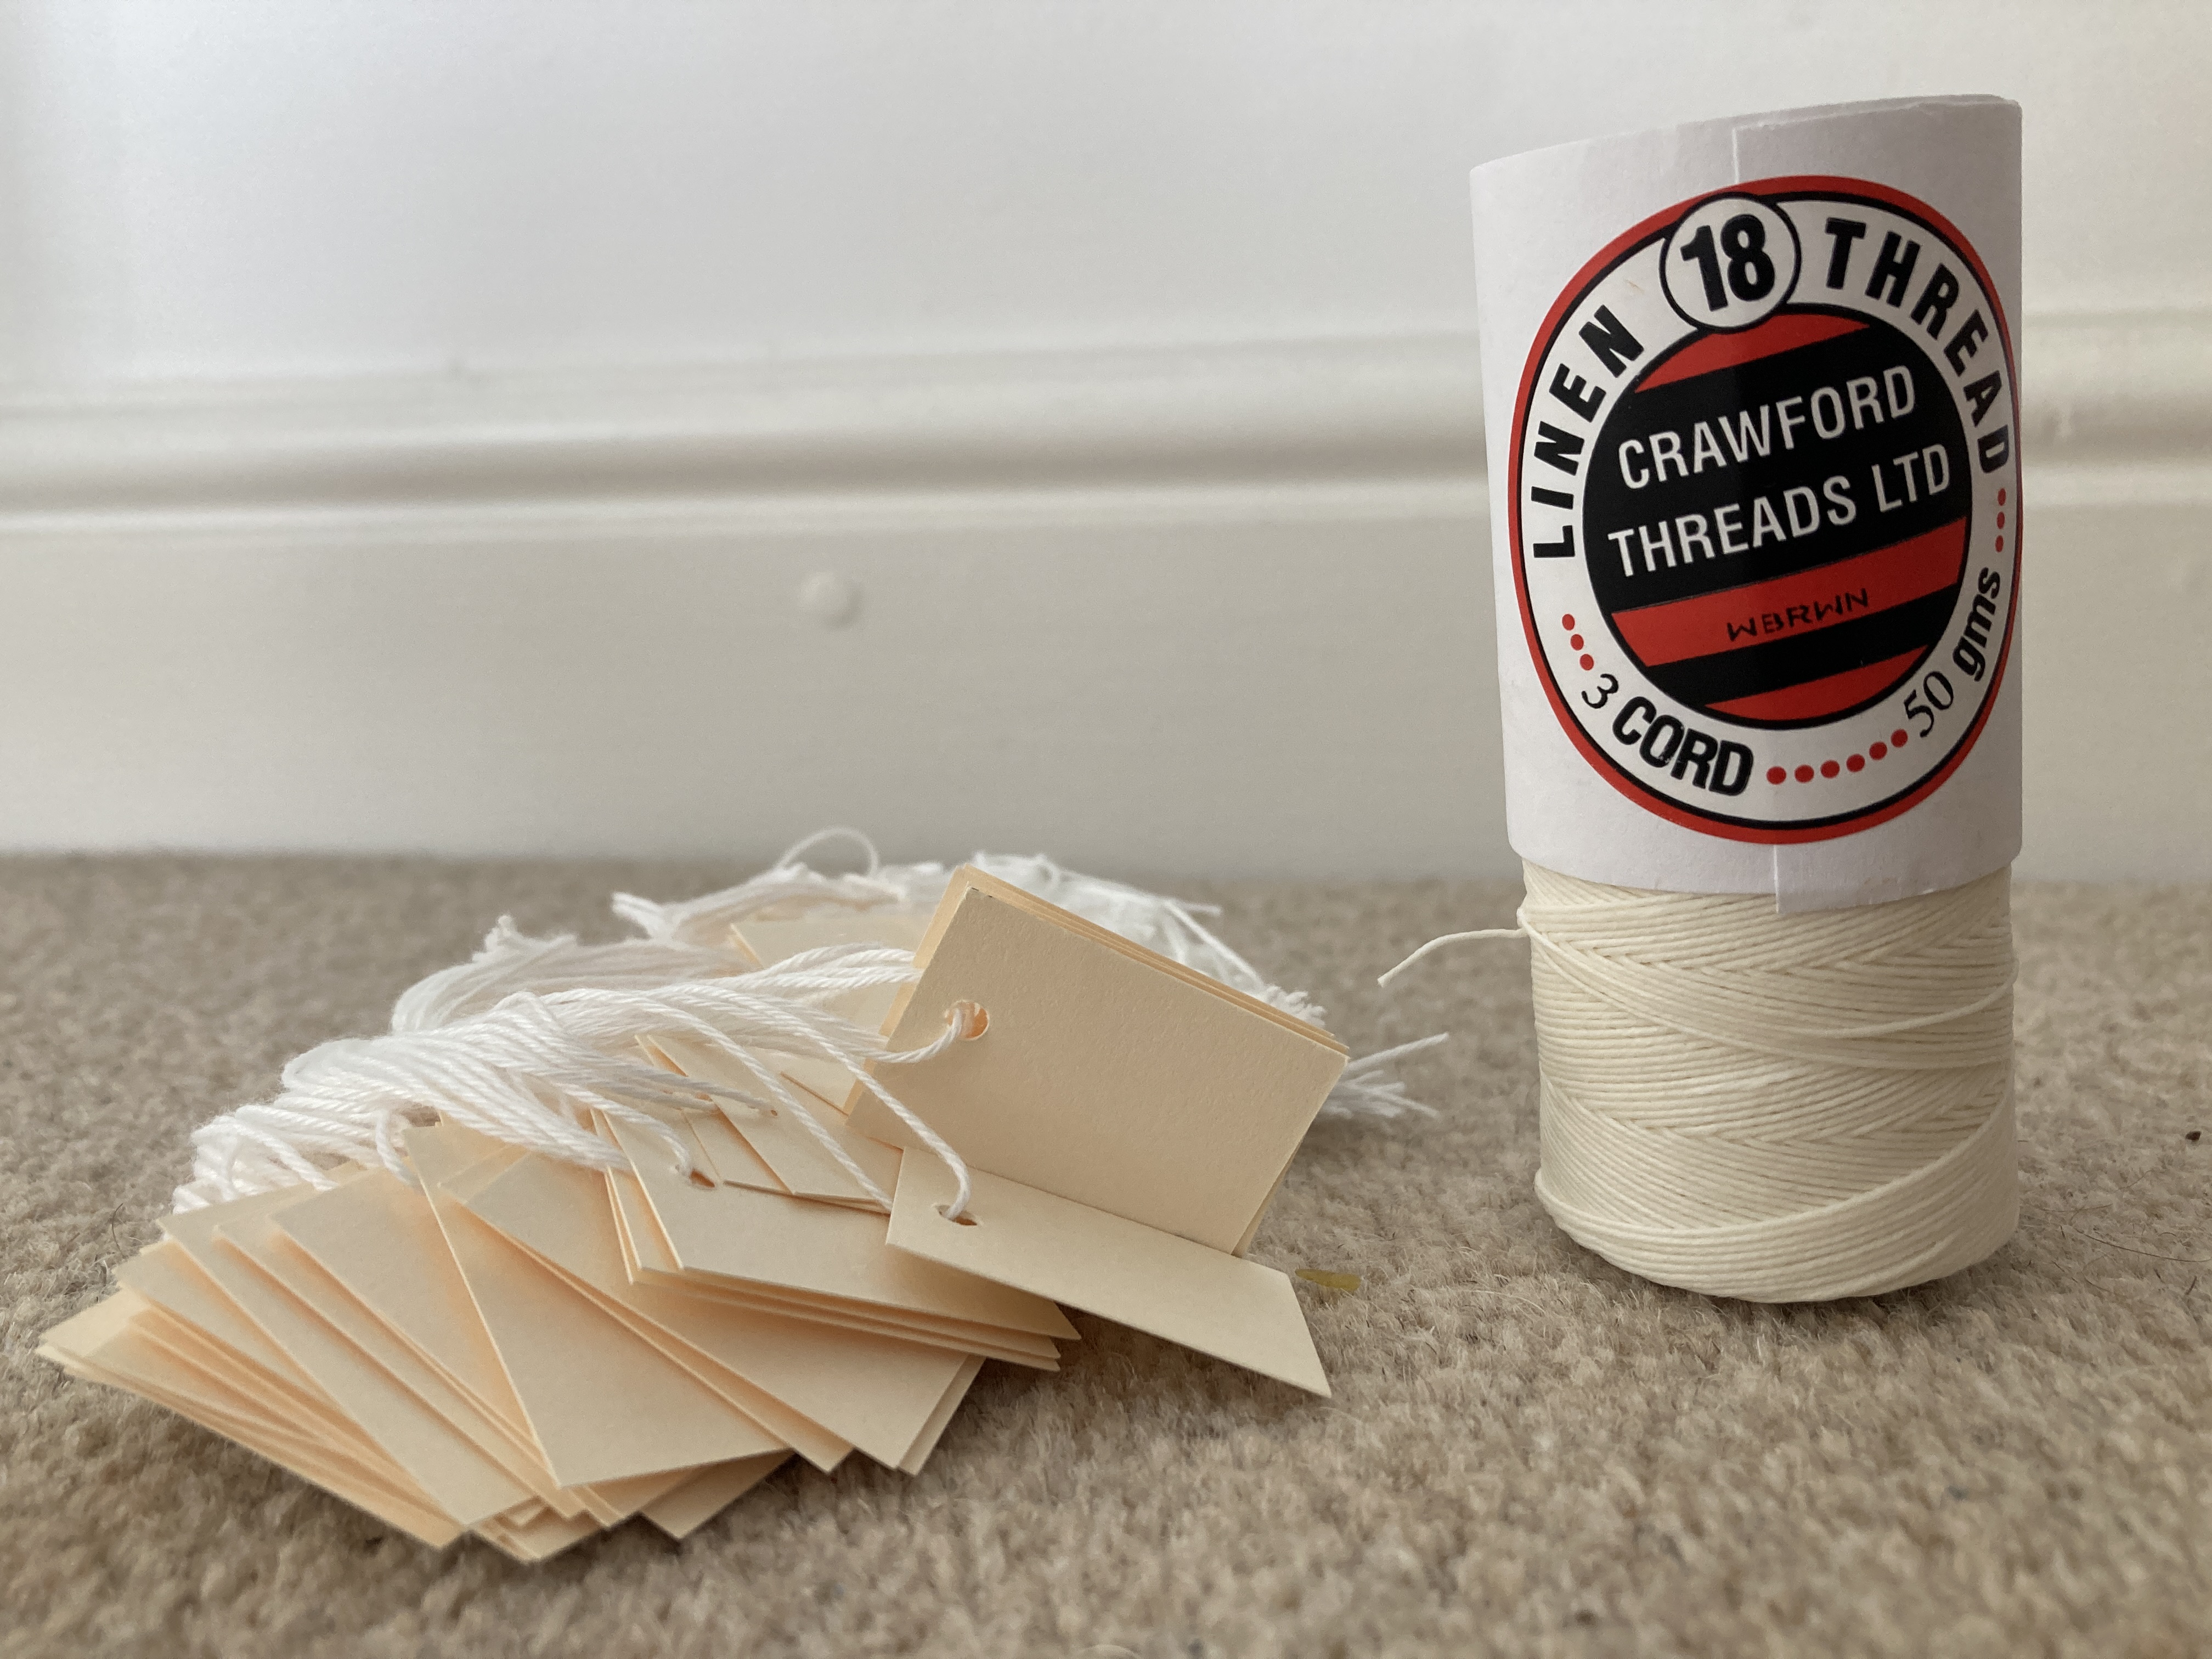
 Although I felt my use of stringed labels was quite successful, I did realise half way through the exercise that the cotton thread I was using when I needed longer string lengths, was not strong enough and might easily break if caught or pulled; and in any case might deteriorate over time. This prompted me to look for archival quality thread and stringed labels, and I duly acquired them for about £15 including postage from Preservation Equipment Ltd as shown below. I shall use them to swap out the labels I have already applied, at some time in the future.